Active stores
48+3
Stores in the portfolioThe Retail Foresight System
Truedge continuously connects sales, inventory, margin, and cash signals, showing retailers what is likely to change, why it matters, and which action protects the plan.
LAUNCHPAD
Consolidated view across 48 stores · FY26 year to date through 30 September.
Active stores
Net revenue
Returns
COGS
Gross margin
Opex
Profit / sq ft
Inventory
Trailing 12 months · Oct 2025 – Sep 2026
Madrid margin below floor
Seasonal stock ageing
Returns spike - footwear
Paris labor cost recovered
Selected stores · FY26 YTD
| Store | Net revenue | vs. prior year | Gross margin | Profit / sq ft | Status |
|---|---|---|---|---|---|
| London Regent Street | $6.8M | +12.4% | 46.2% | $891 | On track |
| Paris Le Marais | $5.9M | +9.1% | 44.8% | $804 | Recovered |
| Berlin Mitte | $4.7M | +7.3% | 43.6% | $728 | On track |
| Milan Brera | $4.3M | +5.8% | 42.9% | $695 | Watch |
| Madrid Serrano | $3.8M | +2.1% | 38.6% | $581 | Below floor |
Retail outlook / next 28 days
Illustrative product view · sample data in USD
$240k
Projected shortfall · next 28 days
$72k
Exposure from demand and mix
$180k
In slow-moving footwear stock
1,200 units
Candidate stock for store transfer
CUSTOMERS TRUST TRUEDGE



Executive overview
Truedge product preview · Synthetic data
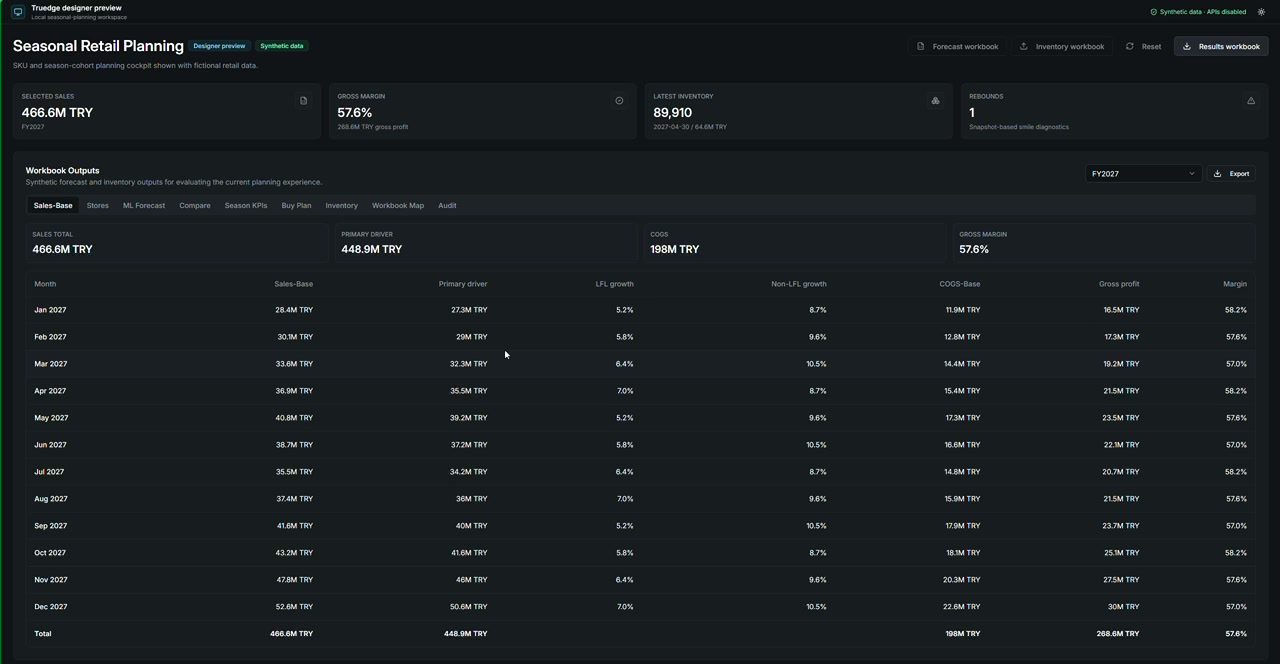
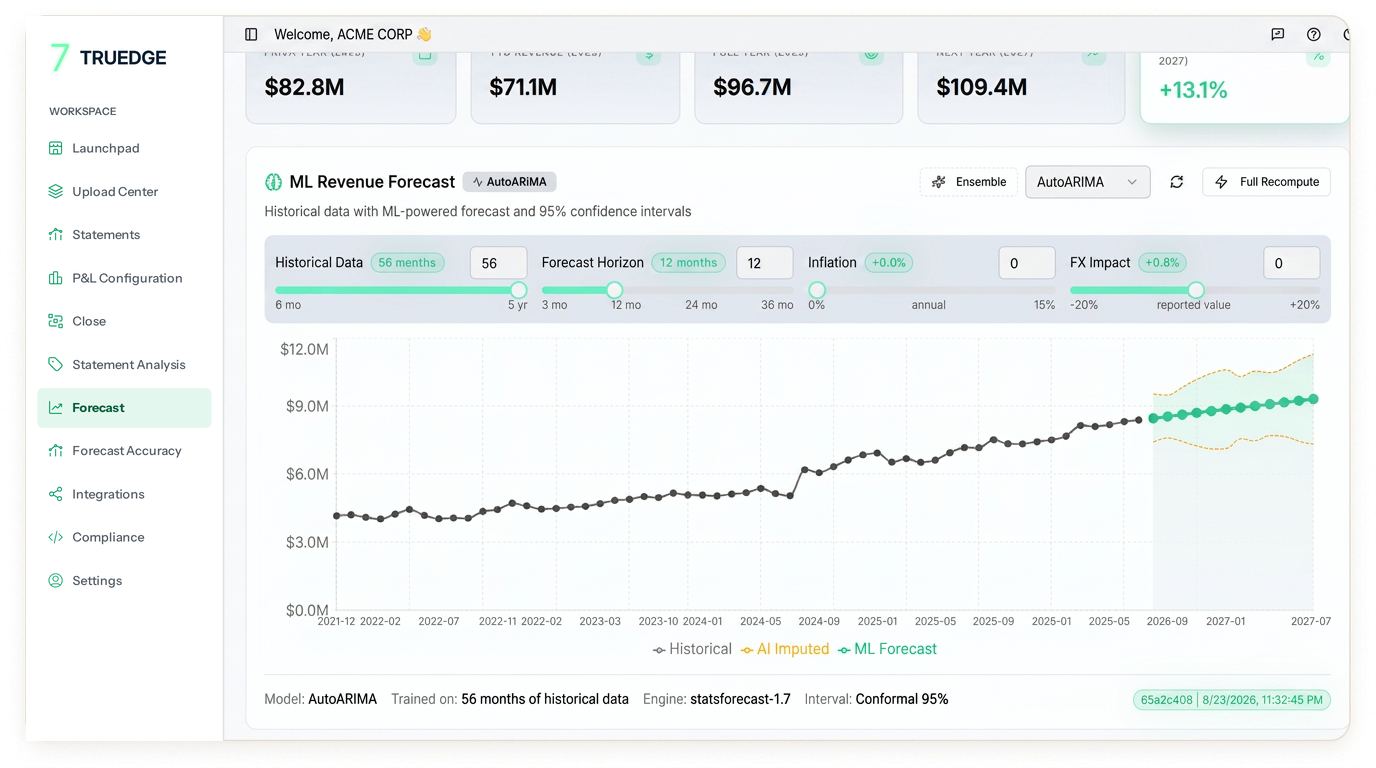


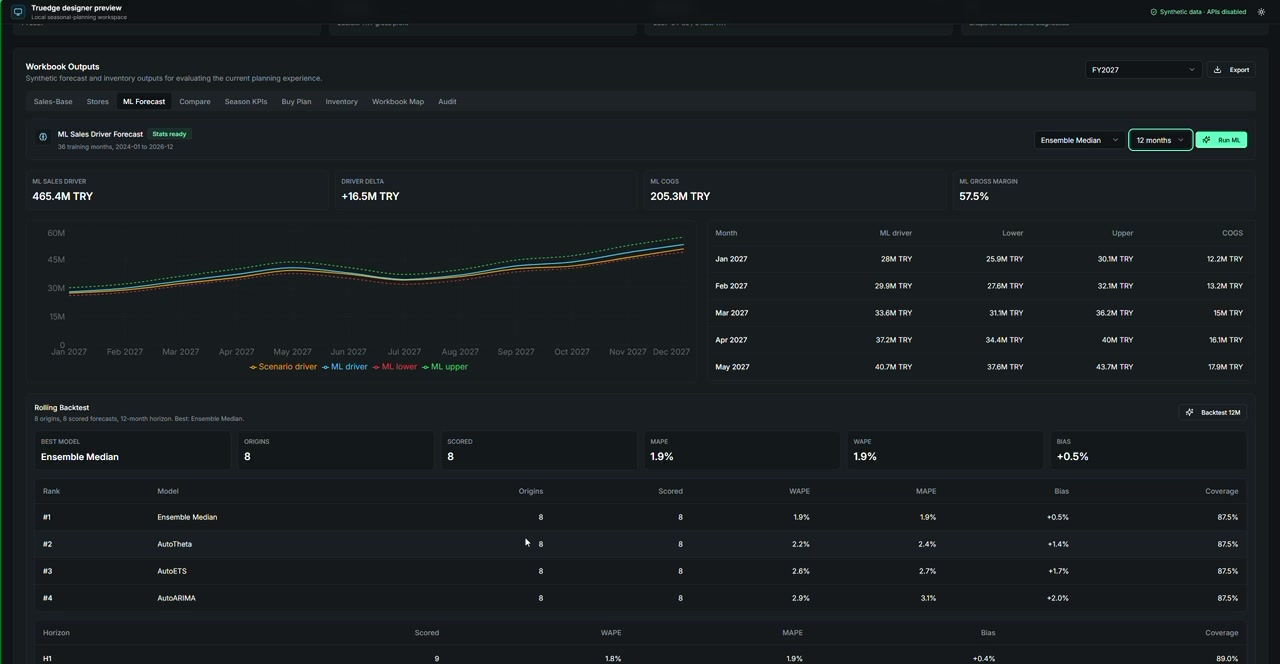
Spot markdown, pricing, and mix risk before it compounds.
Identify where inventory is tying up working capital and what to move first.
See demand and revenue changes before the reporting cycle.
The Decision Window
A slowing category is not just a sales problem. Follow the consequence through margin, stock, and cash, then compare your next move.
Illustrative product scenario.
Sample estimates, not customer results or guaranteed outcomes.
Compare outcomes
Truedge product preview · Synthetic data
ACME CORP / RETAIL OUTLOOK
Women’s footwear · next 28 days
01 What changed
Sell-through slowed in selected stores, while demand for the same sizes held up elsewhere. The category is now tracking below plan.
02 What happens if nothing is done
Slower sales leave more stock exposed to markdowns, reduce margin, and hold cash in inventory.
03 Recommended action
Match available sizes to stores with stronger sell-through; keep pricing intact.
Finance and merchandising review the trade-off before committing.
04 Expected impact
Transfer stock · compared with no action
Illustrative estimates in USD, before transfer or promotion costs. Actual results depend on demand and execution.
One retail outlook across sales, margin, inventory, and cash. Built on the security your finance team expects.
Sales
Catch the demand shift
See where the outlook is moving away from the plan.
Margin
Understand the exposure
Connect pricing, mix, and markdown decisions to profitability.
Cash
Prioritize the next move
See the working capital held in slow-moving inventory.
SOC2
Type II
Enterprise trust and independently audited controls.
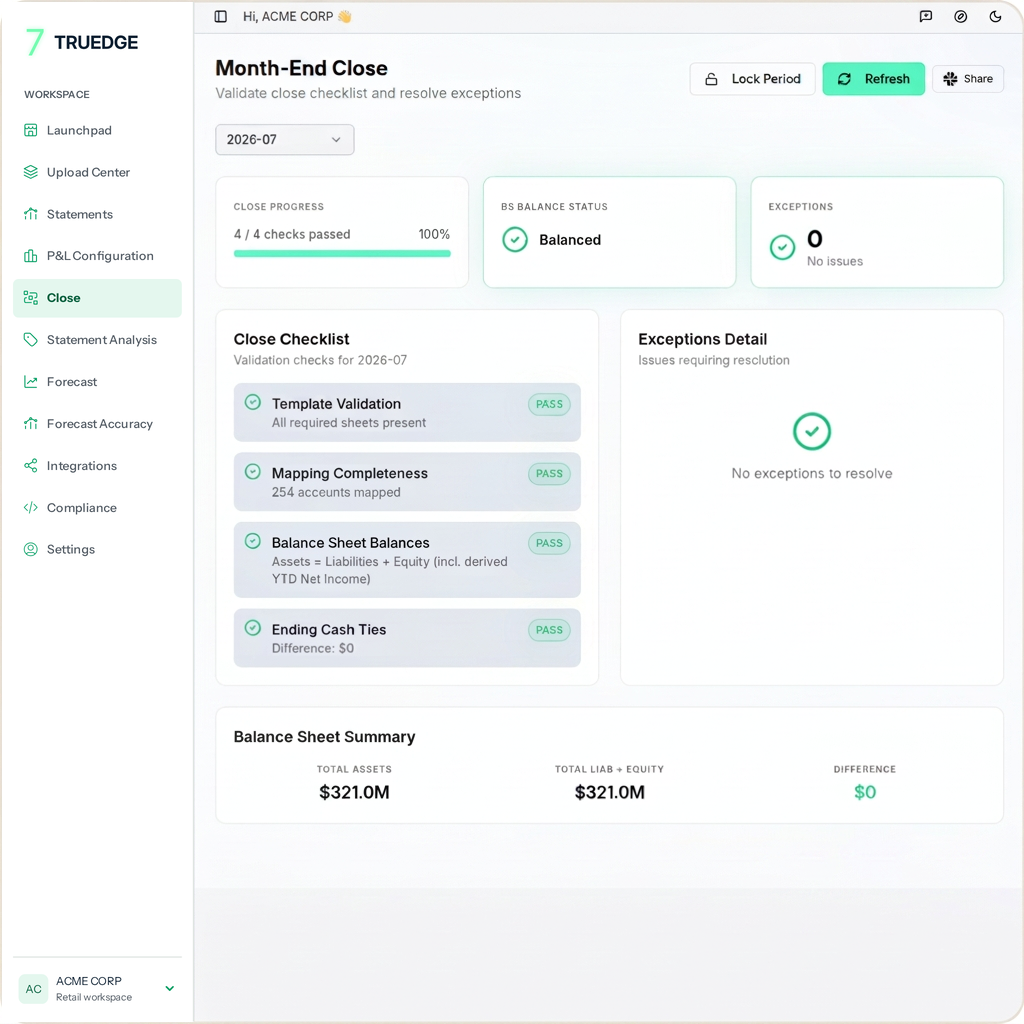
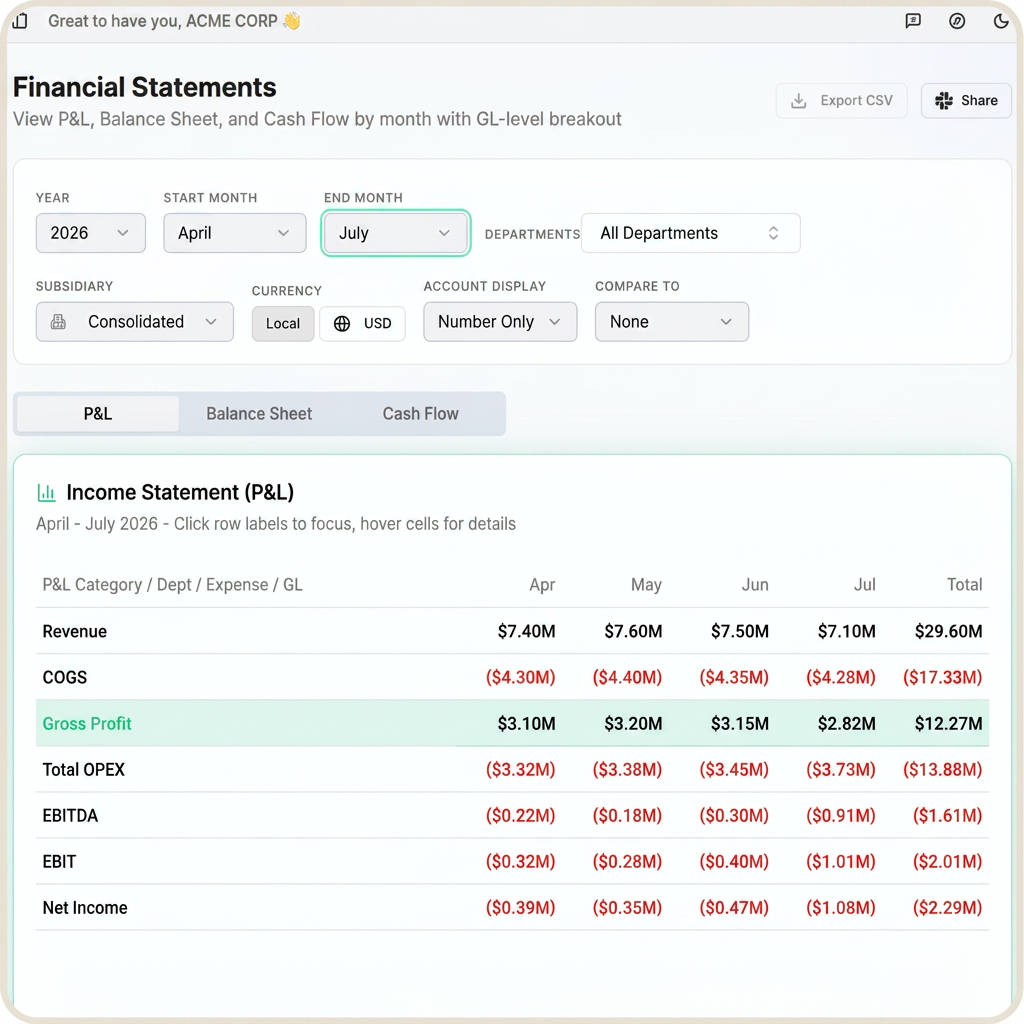
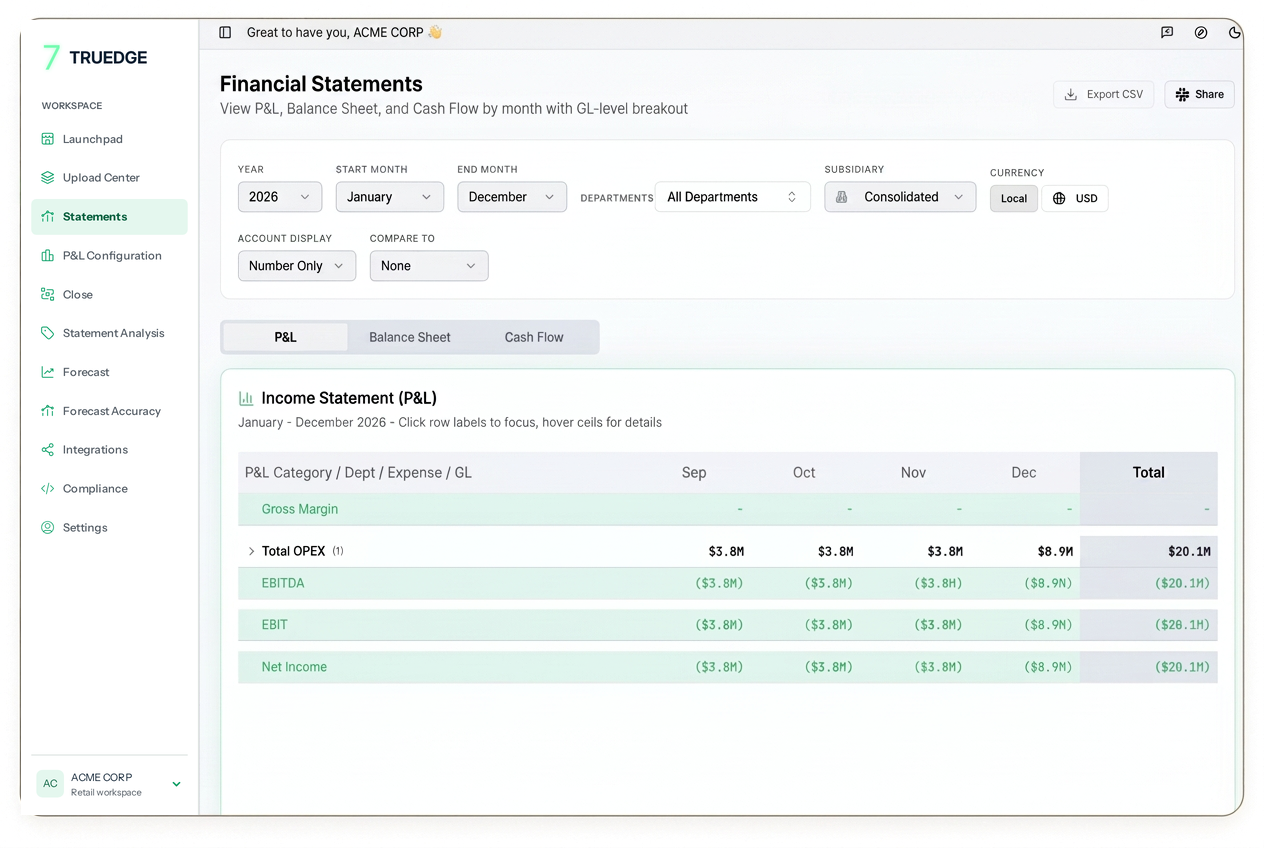
Truedge validates key close checks, surfaces exceptions, and carries the same reconciled financial data into P&L, Balance Sheet, and Cash Flow reporting.
01
Check balances, mappings, and entry consistency.
02
Surface exceptions that need finance review.
03
Move into reconciled financial statements without rebuilding the numbers.
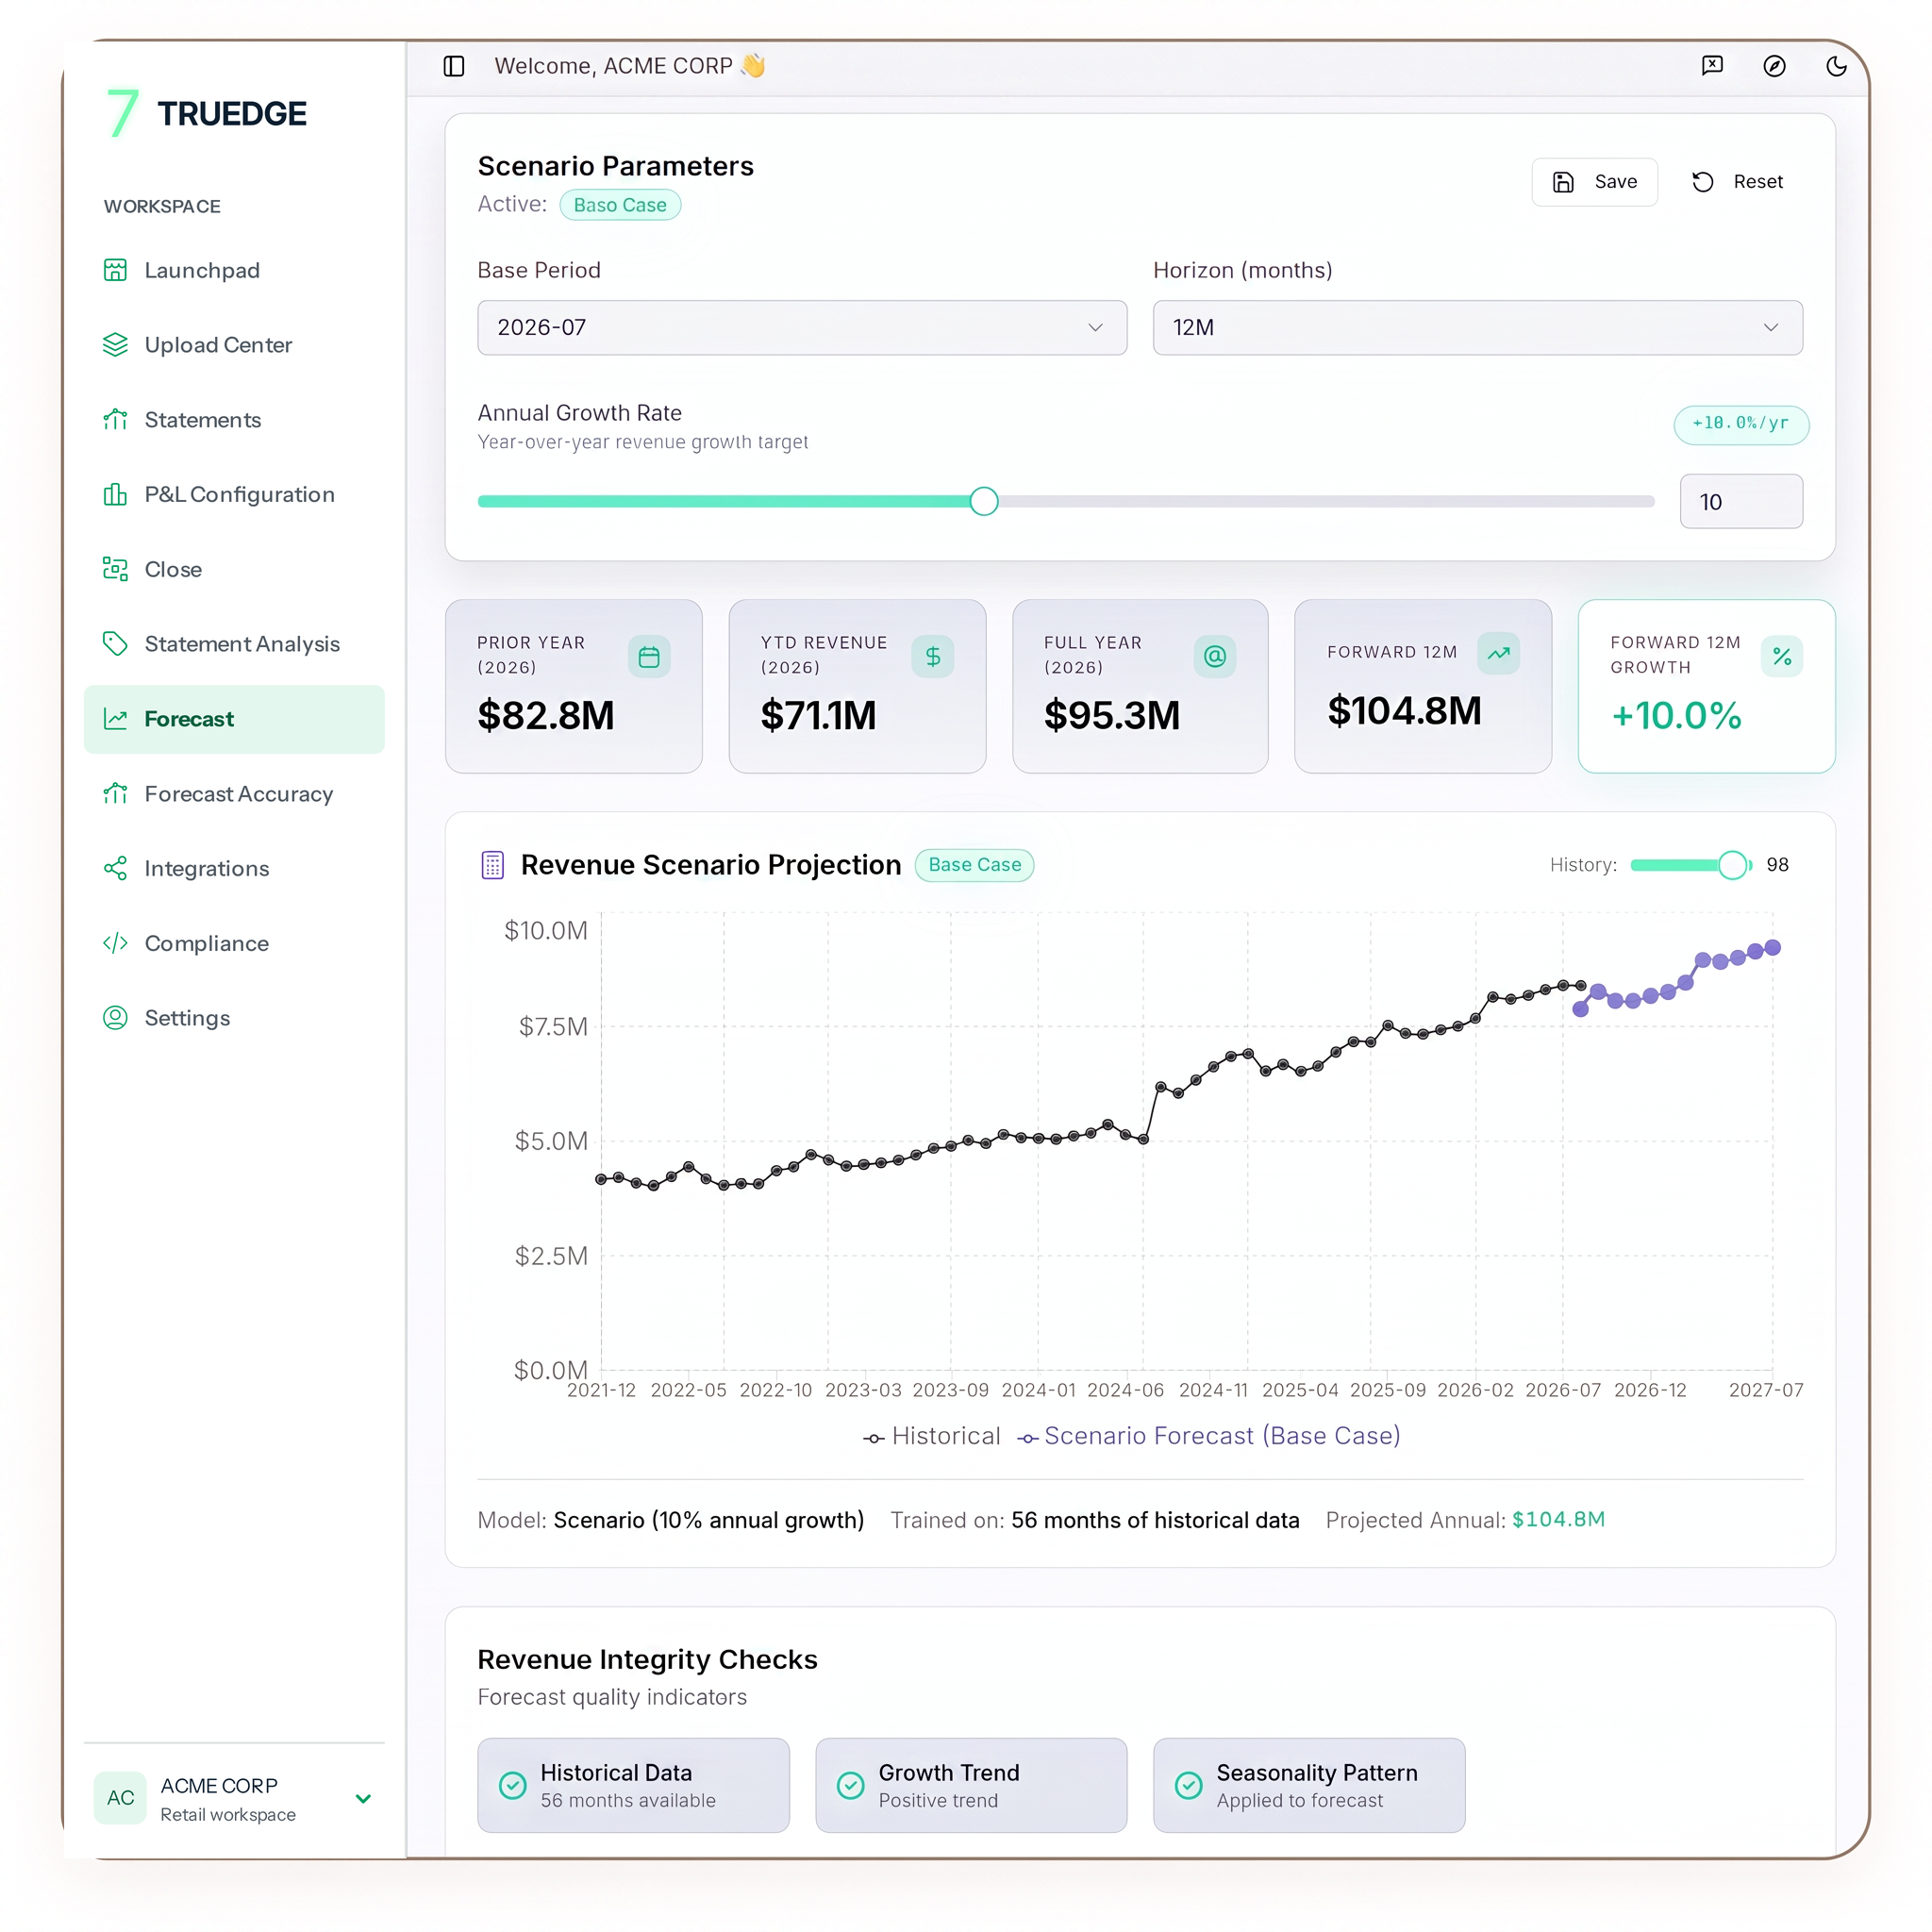
Compare pricing, markdown, replenishment, and stock-transfer options. See the trade-off across revenue, margin, inventory, and cash before committing.
01
Choose the starting period, horizon, and scenario.
02
Adjust the assumptions that matter to the business.
03
See how each scenario changes the financial outlook.

The gap between plan and forecast, broken into the merchandising decisions that caused it.
Protect Margin
Prioritize profitability and cash discipline.
Recommended Plan
Balance growth, margin, and cash impact.
Invest for Growth
Deploy spend or capacity where forecasted return is strongest.
Keep reporting, investigation, and planning connected to the same retail decisions.
Truedge reconciles data across your ERP and operational systems, checks entries for accuracy and consistency, and surfaces exceptions for review so finance teams close faster with a full audit trail.
Investigate performance and business drivers through spoken questions, with a live conversation transcript for review.
A conversational interface to your finance and operational data. Ask what changed, why it changed, and what to investigate next, all from one place.
Build standardized P&L hierarchies, multi-entity roll-ups, and drill-down reporting that reconciles to the ledger, refreshes automatically, and remains exportable to Excel.
Catch changes in retail sales, margin, inventory, and cash at channel, category, store, product, and SKU level.
Build base, conservative, aggressive, or custom scenarios and understand how changes flow through revenue and financial performance.